
Graphics card prices in Korea may climb as much as 30% from August. On August 1, Xbox consoles went up $100 to $150 worldwide and the 2TB Series X was discontinued outright, with Microsoft citing console storage and memory costs up more than 2.5x.
Intuition says an AI buildout is a GPU buildout, so accelerators are where the cost lands. The receipts point somewhere else.
A 32GB DDR5-6000 kit that sold for about $90 in July 2025 now starts around $379. A Samsung 990 EVO Plus 2TB went from $113 to $363.49, up 221.5% in twelve months.
Those are two listings, so here is a broader gauge. The producer price index for storage devices and the consumer price index for software and accessories have both risen 23% since the end of 2024, with the import price index for computers, peripherals and parts up 37%. Official statistics are catching what enthusiast forums noticed a year ago.
Processors moved as well. Between March and April, server CPUs rose 10–20% and consumer parts 5–10%, with another 8–10% expected in the second half. Graphics cards rose roughly 15% globally in the four months to February and have kept going.
Not everything moved. Motherboards, coolers and power supplies have been holding steady or falling, which is the tell. Anything with silicon in it repriced; anything without it did not.
Computer component prices in 2026: three shortages, not one
Each of these markets has been covered here separately, starting with the memory shortage itself back in February. Put side by side, they are not one shortage with one cause. They are three mechanisms sharing a root, which matters because three mechanisms unwind on three schedules.
| Mechanism | What it hits | Where the pressure comes from |
|---|---|---|
| Wafer displacement | DRAM, GDDR, graphics cards | HBM consumes far more wafer per bit than DDR5 |
| Supply allocation | NAND, SSDs, hard drives | Bits steered to enterprise; HDD scarcity spilling into QLC |
| Foundry and pricing power | Server CPUs | Advanced-node contention, plus list increases on scarce SKUs |
Graphics cards sit in the first row. Most explainers give them a row of their own.
Why RAM prices rose: checking HBM’s wafer trade ratio
Micron puts the trade ratio at 3-to-1 against DDR5. Its earlier framing was more precise: producing a given number of bits in HBM3E consumes about three times the wafer supply DDR5 would need at the same technology node. This is wafer supply per bit, not three physical wafers against one.
The figure is quoted widely and tested rarely, which is odd, because TrendForce publishes both halves of the fraction. HBM wafer input among the top three suppliers is put at approximately 18%, 22% and 30% of total DRAM wafer input at the end of 2025, 2026 and 2027, against HBM bit supply of roughly 8%, 9% and 13% of total DRAM bits.
Set HBM’s bits per wafer against everything that is not HBM. In 2026 that is 9% of the bits off 22% of the wafers, against 91% off the remaining 78%.
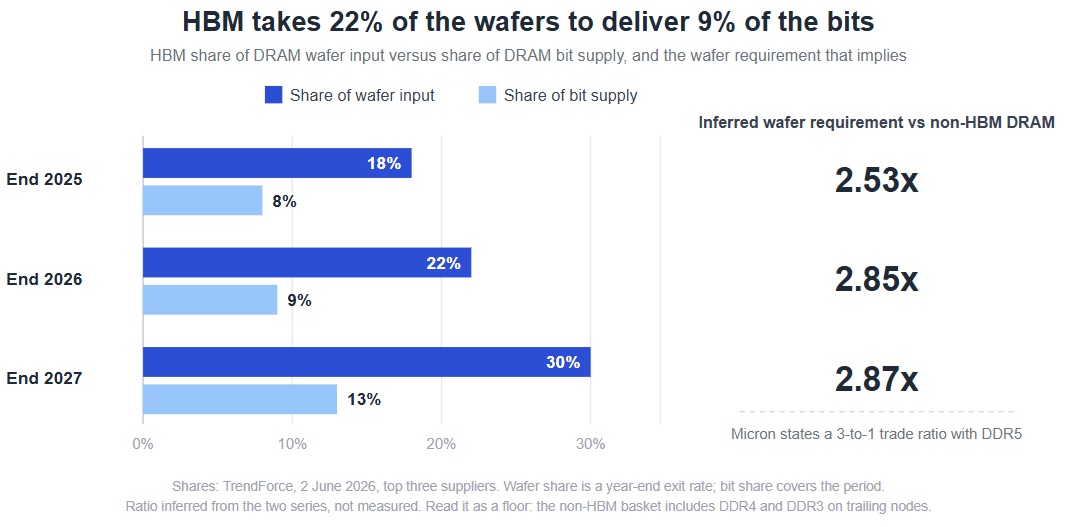
Read that as a floor, not a measurement. The non-HBM basket includes DDR4 and DDR3 on trailing nodes, which yield fewer bits per wafer than DDR5, so comparing HBM against DDR5 alone would push the number higher.
So it works as a cross-check on Micron’s roughly 3-to-1 — not an independent one, since both rest on industry data, but assembled from different inputs and landing close together.
One oddity is worth naming. The inferred ratio is flat from 2026 to 2027, in exactly the window where Micron guides the ratio above HBM3E’s level for HBM4. Either TrendForce’s year-end convention smooths the step-up, or the two series disagree. The published numbers do not settle it.
HBM is about a tenth of DRAM bits, so what explains the rest?
Here is what the same figures make awkward. HBM is 9% of 2026 DRAM bits, yet it routinely gets treated as the explanation for nearly the whole shortage. A tenth of the bits cannot carry that.
Conventional supply is not shrinking either. Micron expects industry DRAM bit shipments to grow in the low- to mid-20s percentage range in 2026. Strip out HBM and non-HBM bits still come out roughly a fifth above 2025. That leans on one supplier’s guidance, which sits at the optimistic end of published estimates — but the conclusion survives a lower figure, because any positive number breaks the “HBM ate the supply” reading.
So supply grew and a mainstream 32GB DDR5 kit still rose more than fourfold. TrendForce puts the 2026 DRAM sufficiency ratio at about −1% to −2%.
Small gaps producing violent price moves is how commodity memory has always behaved, because short-run supply is fixed and demand near capacity is close to inelastic. Compounded quarterly contract increases carry a good deal of the retail move.
There is also a structural reason the gap lands so hard on everyone outside the data center. Hyperscalers have locked fabricator output into long-term agreements that in some cases run five years or longer, which removes the flexibility to swing capacity back toward consumer parts when demand shows up there. The supply is not merely tight. Much of it is already promised.
The uncomfortable part is the direction of travel: that sufficiency gap is expected to widen in 2027.
Why SSD prices rose: allocation, not wafer math
There is no NAND equivalent of the trade ratio. An enterprise QLC die and a client QLC die cost about the same silicon. Suppliers raised bit output in 2026 mainly through process migration rather than capacity expansion, then chose where the bits went.
The choice paid. Enterprise SSD revenue surged 86.1% quarter on quarter past $18.46 billion in 1Q26, on contract prices up around 80% in the same three months. TrendForce forecast in January that enterprise SSD would become the largest NAND application segment in 2026.
Spinning disk is the quiet participant. HDD supply shortages pushed cloud operators to reallocate orders to enterprise SSDs, and high-capacity QLC is now expected to take the largest share of incremental NAND demand. A drive technology nobody associates with AI helps set the price of one that is.
Why graphics card prices rose while graphics memory demand softened
Graphics cards got more expensive, and the reason sits upstream of the GPU die.
Nvidia supplies RTX 50-series silicon and GDDR to board partners as a bundled kit, so rising GDDR7 cost flows straight into board pricing. TSMC wafer increases are in that mix too.
AMD raised its own kit prices around 10% from July 2026 once the contracted memory pricing that held 2025 cards steady expired. Memory is reported to exceed 80% of a graphics card’s bill of materials — a supply-chain figure, not a disclosure, and disputed.
Then the detail that inverts the framing. TrendForce has graphics DRAM demand softening across 2026 — the RTX PRO 6000 Blackwell did not generate the expected wave of GDDR7 demand, and notebook shipments weakened. Prices rose anyway, because graphics DRAM supply is constrained by DDR5 capacity, which shares similar process technologies. That was a January projection; the same reading held six months later, with suppliers reallocating capacity toward other mainstream products.
Demand for graphics memory eased and it got dearer regardless. That is a wafer allocation decision reaching the GPU sideways, through its memory — the card-level version of which showed up in May, when RTX 5090 prices kept climbing on a wholesale hike and the GDDR7 shortage behind it.
Why server CPU prices rose without a foundry bill
The lazy version of this article would fold processors into the memory story. Part of it is advanced-node contention: Intel, AMD and Nvidia’s Vera CPU all sit on TSMC N3, and supply has not responded in time, with lead times stretching from one or two weeks to roughly eight to twelve.
Cost pass-through explains less than it looks. Intel lifted Xeon 8592+ from $11,600 — its launch and 2025 list price — to $12,992, and two consumer SKUs by $30–$50, while leaving the flagship Core Ultra 9 285K at its launch price.
The consumer parts that rose are TSMC-built. Xeon is fabbed in-house, so TSMC’s wafer increases cannot by themselves account for the largest move on the board. Packaging, substrates, test and depreciation all cost more than they used to. But raising list on precisely the SKUs customers had already proved willing to pay above list for looks like pricing power layered on top of those costs.
That has a second-order effect worth watching. When a current-generation Xeon’s list price climbs, the installed base one generation back gets pulled up with it, because the cheapest route to more cores stops being a new box.
What predates the AI boom
The industry entered this cycle with less DRAM capacity than it had in 2022. Micron described a material structural reduction in DRAM and NAND wafer capacity, ending fiscal 2024 a low double-digit percentage below its fiscal 2022 peak. It attributed that to reusing older-node equipment for leading-edge conversions, and called the pattern industry-wide.
The rebuild is underway and expensive. Micron’s fiscal 2026 capital spending runs around $27 billion, against the roughly $20 billion it planned six months earlier. Cleanrooms take years, and none of that output lands in 2026.
New capacity is a condition for relief, not a guarantee of it. Fresh wafer starts can be absorbed by demand that grew while they were being built, and suppliers still choose what to run on them.
When will the memory shortage end? Three different clocks
This is where the mechanism split earns its keep, because relief is arriving component by component.
Client SSD buyers have leverage now. OEM inventories built through the first half, and reluctance to accept another increase has pushed suppliers toward flexible pricing on client drives. Enterprise SSD buyers have none, because that is where the capacity is going.
NAND is the first market with a stated turn. TrendForce expects its sufficiency ratio to turn positive in 2027 and supply to loosen in the second half of that year, moving toward balance — while DRAM tightens further. For anyone deciding what to buy now and what to defer, that divergence is the most useful line available.
Client CPU supply improved steadily through the second quarter. Server CPUs run the other way, with another 8–10% expected in the second half.
DRAM is the long one. Contract increases decelerated to 13–18% quarter on quarter in Q3, but the stated reason is consumer buyers hitting their affordability limit, not supply catching up. A slower rate of increase is still an increase.
What it means for hardware already installed
DDR4 tracked DDR5 almost exactly on the way up. A 32GB DDR4-3200 kit went from roughly $48 to about $200, close to the same multiple as the DDR5 kit above. A decade-old standard on trailing nodes has no business moving in lockstep with the leading edge, and it did, because the capacity that used to make DDR4 cheap went somewhere else.
Memory costs are projected to peak at 23% of a PC’s bill of materials, up from 16% in 2025, and some vendors now ship pre-builts with no memory in them rather than quote the RAM.
For anyone holding decommissioned equipment, that reverses a normal assumption. Older generations are supposed to depreciate quietly on a shelf. This cycle the modules and drives pulled from a retiring chassis are the components under the most pressure, which is why what used server memory is worth has stopped being a rounding error in refresh planning, and why getting pulled DDR4 and DDR5 modules valued belongs in the decommissioning checklist.
The signal to watch is not next quarter’s contract print. Per-wafer revenue on HBM was overtaken by DDR5 64GB RDIMM in 1Q26, taking HBM profitability below it, and suppliers are expected to adjust allocation between the two depending on how HBM pricing lands. The same forecast has HBM contract prices rising by multiples in 2027 and the crowding-out of conventional DRAM intensifying.
Those two things pull in opposite directions, and three suppliers get to decide which one wins. That allocation call, not the next spot reading, sets what all three of these markets cost next year.